
Smartlook player
The Smartlook player
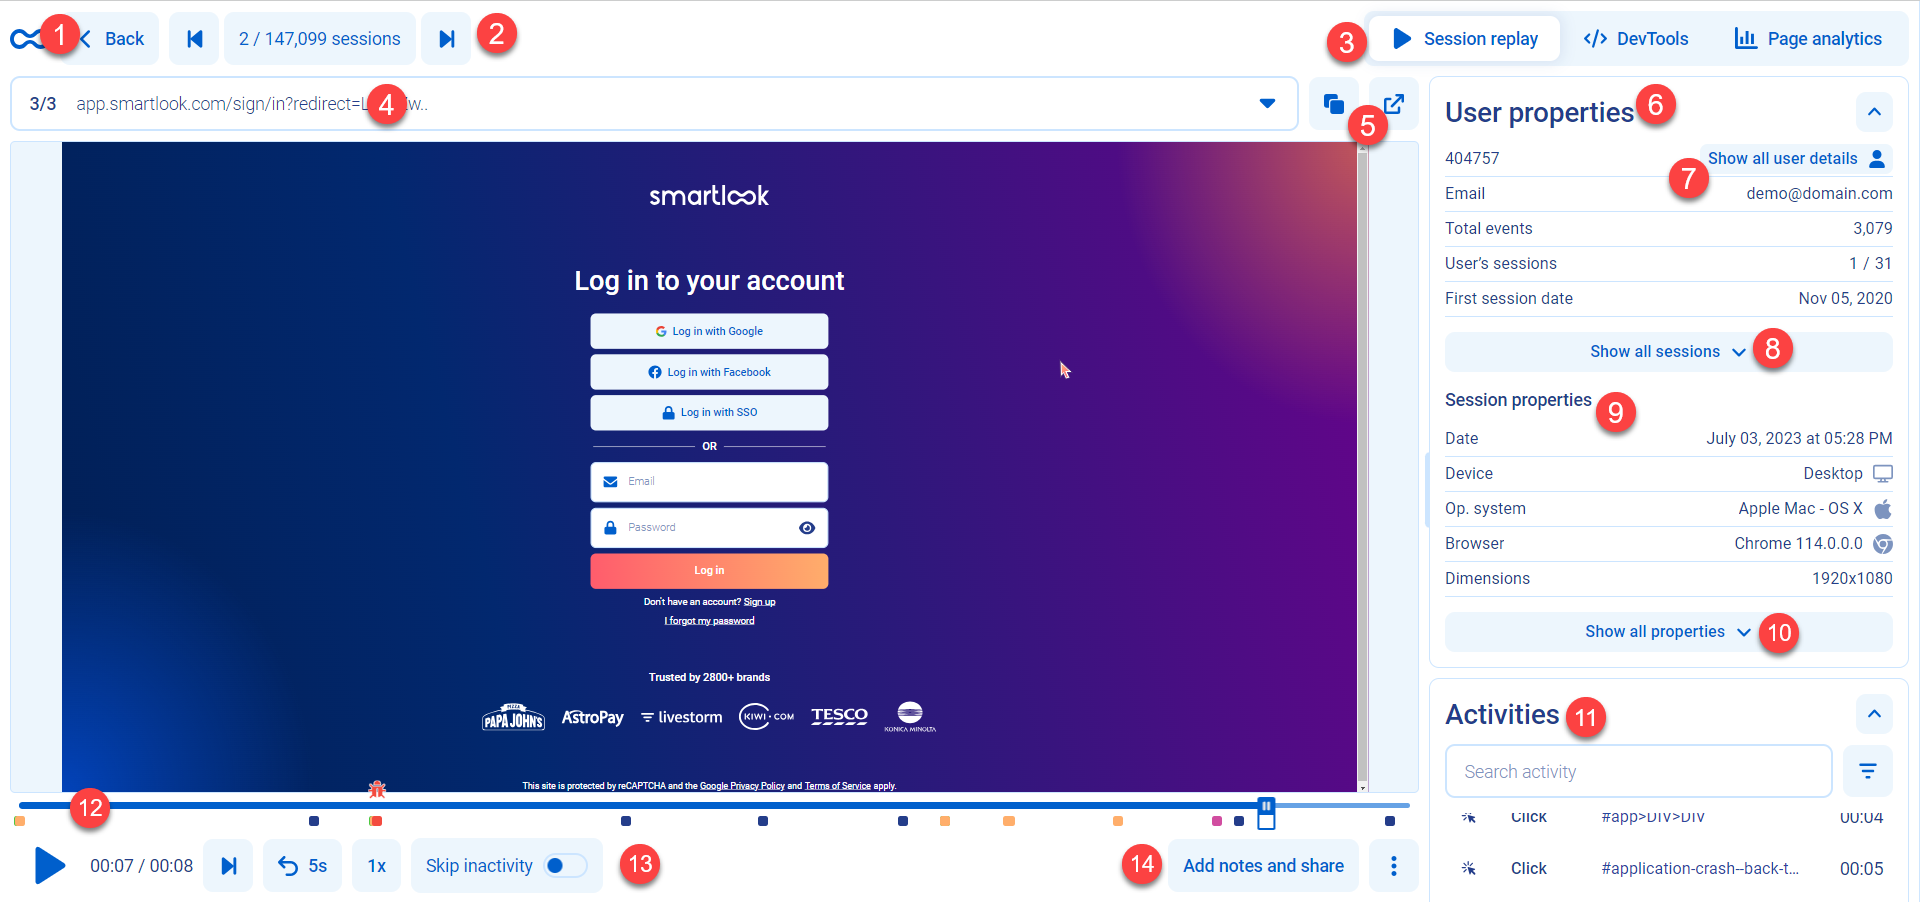
The Smartlook player is how you view and interact with user sessions.
The Smartlook player
| 1 | Go back | Go back to list of sessions |
| 2 | Session navigation | Go to next or previous session, choose a session from the list |
| 3 | Session replay and DevTools | Switch between session data, Smartlook DevTools, and Page analytics |
| 4 | Display URL | The URL the user is viewing in the session |
| 5 | Copy/Open URL | Copy or open the URL shown in the Display URL bar |
| 6 | User properties | User properties |
| 7 | Show all user details | View more details about the user |
| 8 | Show/hide all sessions | View all sessions from the user |
| 9 | Session properties | Session properties |
| 10 | Show/hide all properties | Expand to view all available user and session properties |
| 11 | Activities | View and filter user activities in the session |
| 12 | Timeline | Session timeline with events |
| 13 | Session player controls | Control how you view your session |
| 14 | Add notes and share, more info | Add notes, share the session, create an issue, and more. |
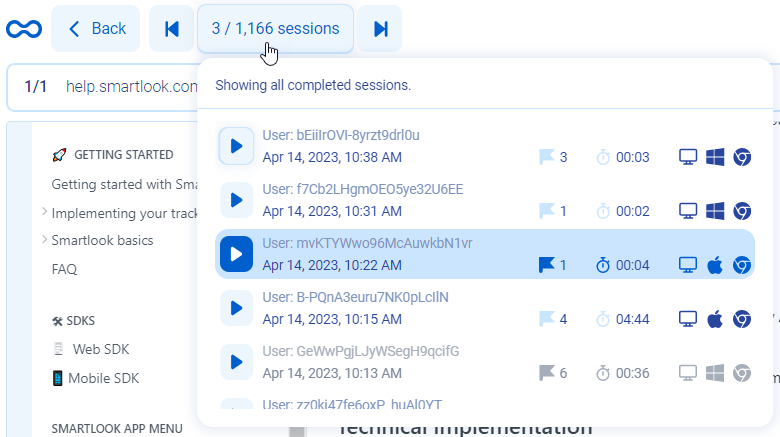
Session navigation
Move to the next or previous session using the arrows. You can also browse sessions in the segment by clicking the session counter.
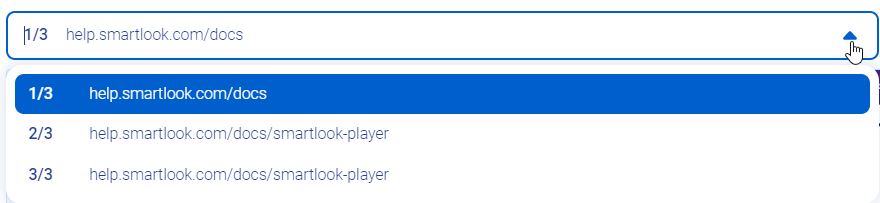
Display URL
The display URL shows all URLs the user visited during their session. You can skip to a URL in the session by choosing it from the dropdown menu.
User and session properties
User and session properties contain a list of available user and session properties for the session you are viewing. Basic information included is the user, first session date, how many sessions are attributed to the user, and the total events for the user.
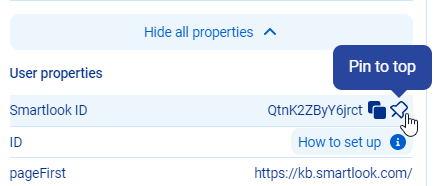
All properties that you can view in the panel are pinned. You can pin other properties to the panel by clicking Show all properties, opening the User properties and Session properties, then clicking Pin to top for all properties you want to view in the panel.
Show all user details
By clicking Show all user details, you can view a panel that includes all data Smartlook contains about the user. This data includes other sessions, location, dimensions, and other statistics.
To get more detailed information about the users in your sessions, such as their email address, you need to implement the Identity API.
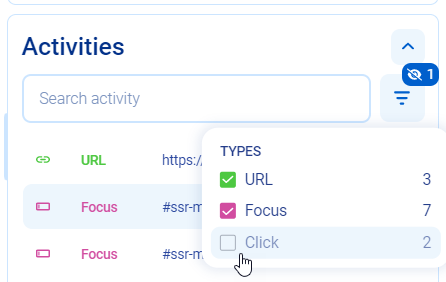
Activities
View a list of activities from the session and when they occurred. You can filter the types of activities by clicking Filter and choosing which activities to view. For more information, see Events.
Session timeline and controls
The session timeline shows you what events occurred and when.
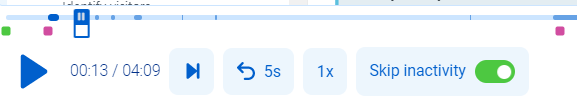
You can control your viewing of the session using the session player controls. The functions in the player controls are: player controls are:
- Play/pause the session
- Skip to the next session
- Go back five seconds
- Change the session playback speed. Options are: .5x, 1x, 2x, 3x, and 5x.
- Skip inactivity. Enable to view only sections of the session when the user is active
- Share and note button. Create a note, share the session, and send to Jira or Slack.
- More options. View session hotkeys, the legend for the player, add the session to the vault, enable or disable AutoPlay, and fullscreen mode.
Adding notes, sharing, and more options
Click Add notes and share to open a window to add a note to the session or share it with others. For more information, see Sharing and adding notes to sessions.
You can also send the session directly to your teams after you integrate with Slack and Jira. For more information, see the Smartlook Slack integration and Jira integration.
Click the More icon to open more options for viewing your session including: Add to vault, AutoPlay sessions, view a list of hotkeys, a legend, and view the session fullscreen.
DevTools
Smartlook DevTools allow you to view your project’s performance during user visits. The DevTools in the player work in the same way as the DevTools in your internet browser.
For more information, see Smartlook DevTools.
Page analytics
Page analytics displays a heatmap for all sessions for a given URL.
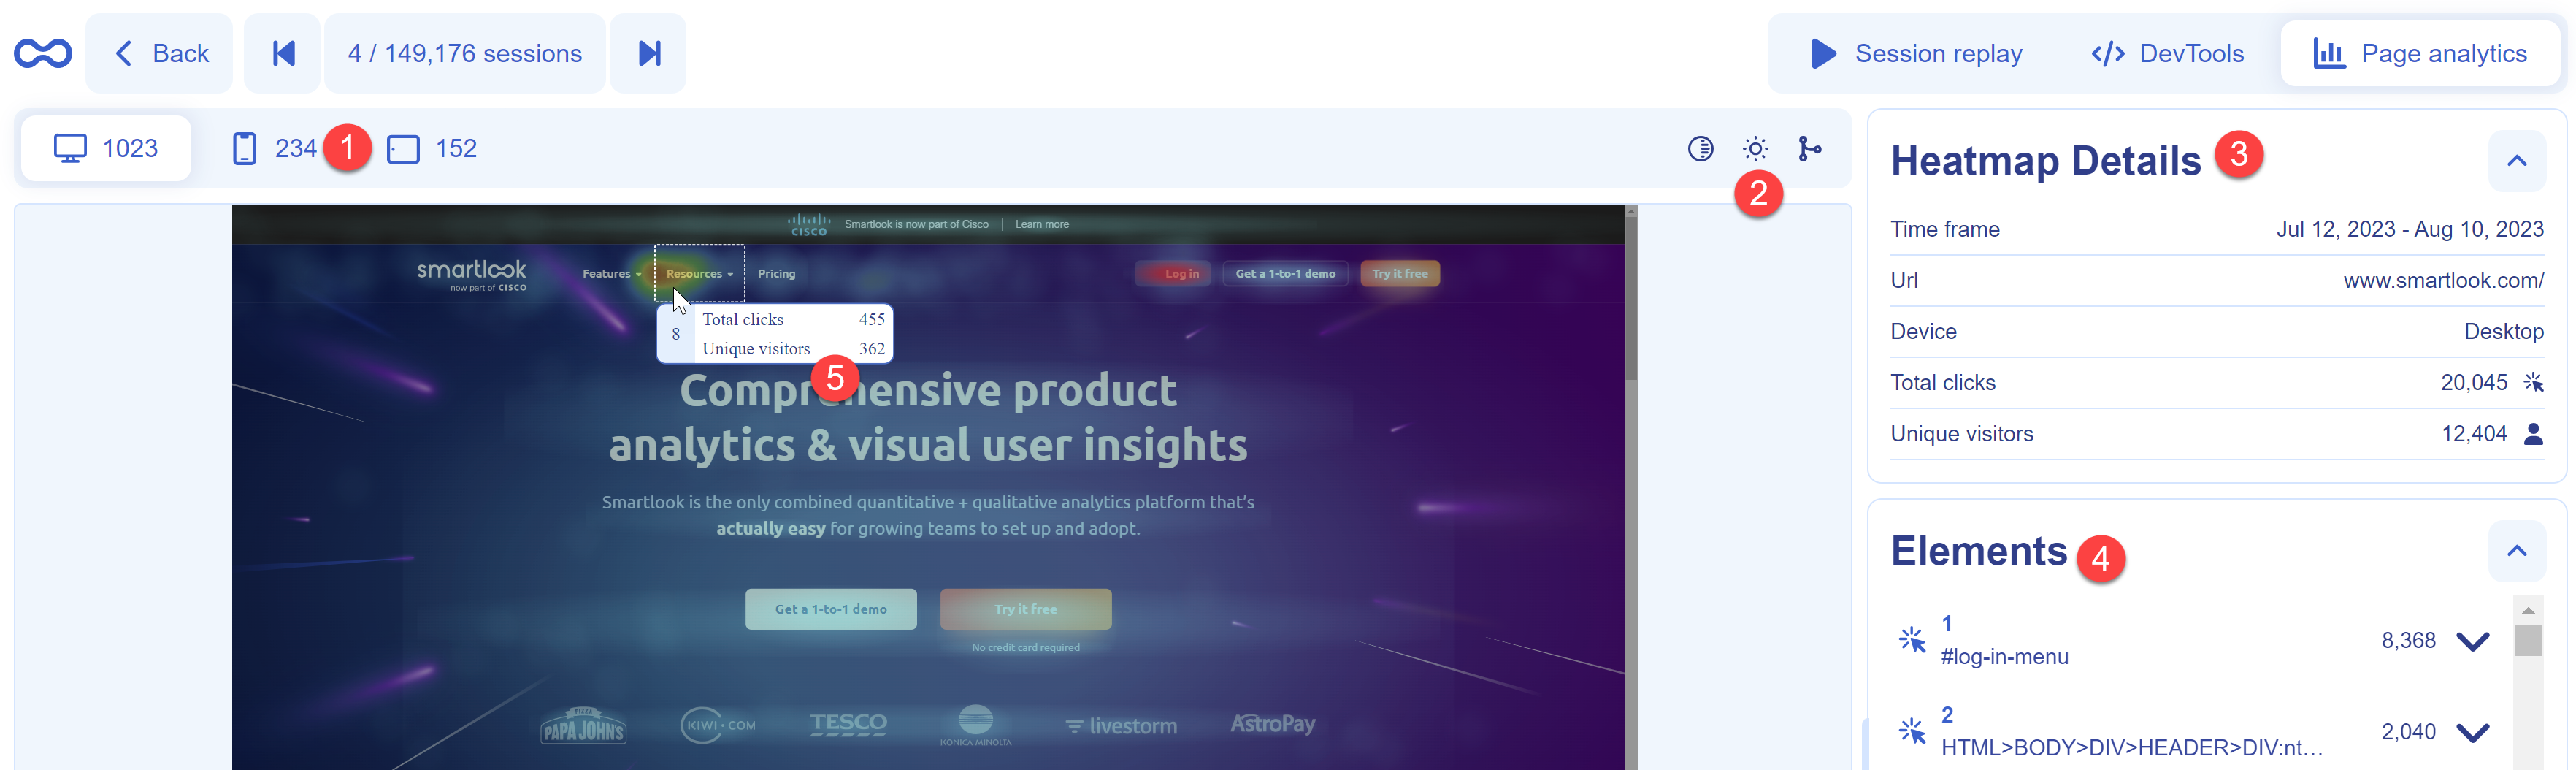
| 1 | See how many users viewed your project using computers, mobile phones, and tablets |
| 2 | Adjust the opacity, intensity, and Element clustering level. |
| 3 | Heatmap Details—provides information about the heatmap. |
| 4 | Elements—Displays a list of elements in the heatmap. Elements are ordered by highest number of clicks. Expand an element to see more details. |
| 5 | Hover over elements in the heatmap to see Total clicks and Unique visitors for that element. |
| 6 | Leave us feedback. Because this feature is in Beta, we'd love to hear any feedback you have. |
Element clustering level
If you are using dynamic elements in your project, elements can move to different areas of your project. This can lead to your heatmap showing activity where there is no element. To remedy this, you can set the level of element clustering so elements cluster in one area.
- Slider towards Min—Recommended if your project does not use dynamic elements. Elements show where they appear.
- Slider towards Max—Recommended if your project uses dynamic elements. The more you move the slider towards Max, the more your elements are clustered in one place.
Updated 6 months ago